Interrupts
Interrupts can be traced with an API that is rather similar to normal general purpose value markers. They are also identified by a 32-bit ID, and can optionally be named but don’t otherwise require any kind of configuration.
Note that unlike event markers, they are local to one core. If two cores share an interrupt, you will have to name it on both cores.
Tip
Tracing of frequent interrupts may require significant resources.
Example
In the example below, an interrupt routine is being traced:
#include "tband.h"

#define TICK_ISR_ID 0

// Setup:
void setup(void) {
    tband_isr_name(TICK_ISR_ID, "tick");
}

void systick_isr(void) {
    tband_isr_enter(TICK_ISR_ID);
    // ...
    tband_isr_exit(TICK_ISR_ID);
}
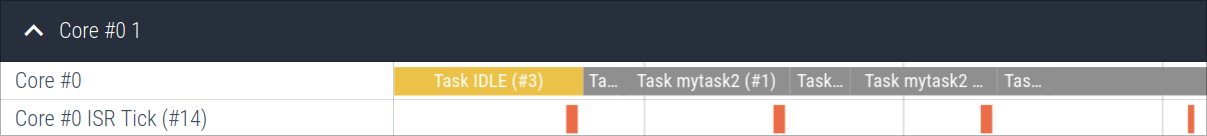
ISRs are visualized next to the core they are associated with. The example
below shows a trace of the SysTick interrupt while FreeRTOS is running:
Configuration
Interrupts are only traced if the config option tband_configISR_TRACE_ENABLE is enabled.
API
tband_isr_name:
void tband_isr_name(uint32_t id, const char *name);
Name the interrupt with id id. This is a metadata event. If the metadata buffer is enabled,
it can be emitted at any time before or during the tracing session.
tband_isr_enter:
void tband_isr_enter(uint32_t id);
Trace the beginning of an interrupt.
tband_isr_exit:
void tband_isr_exit(uint32_t id);
Trace the end of an interrupt.