Tonbandgerät
Tonbandgerät /ˈtoːnbantɡərɛːt/ n.
- German for audio tape recorder.
- An electrical device for recording sound on magnetic tape for playback at a later time.
A small embedded systems tracer with support for bare-metal and FreeRTOS-based targets.
Philipp Schilk, 2024
Overview
Tonbandgerät’s core is a small, portable, trace event generator and handler written in C and designed for embedded systems. It requires minimal porting and configuration, and features multiple backends for gathering and transmitting traces.
It can be used both with an RTOS, or in bare-metal environments to instrument user code and track hardware events by tracing interrupts. Full tracing of FreeRTOS tasks and resources is also supported out-of-the-box.
Tonbandgerät is based on a simple custom binary trace format designed to be fairly fast to encode and keep traces as small as possible. Recorded traces can be viewed in Google’s in-browser perfetto after conversion with the provided CLI tool or in-browser converter.
Documentation
The documentation for Tonbandgerät can be found in the docs/ folder and compiled for viewing with mdbook
by running mdbook build in docs/. The latest version of the documentation can also be viewed online here.
Trace Converter + Viewing
The trace converter is written in rust, can be found here. For convenience, there is also a WASM version with web frontend, which runs in the browser and can be found here.
Licensing
The target tracer sources and documentation are released under the MIT License. All conversion and analysis tools, such as the decoder and converter, the CLI, and the web converter are released under the GNU GPL3 License.
Status
Note
Tonbandgerät is in early development and by no means considered stable. Everything - including the binary trace format - is subject to change.
Please report any issues here.
Completed:
Tonbandgerät:
- Trace encoder.
- Streaming backend.
- Snapshot backend.
- Metadata buffer.
- Initial FreeRTOS support.
Conversion tools:
- CLI converter.
- In-browser converter.
Other:
- STM32 + FreeRTOS example project.
Work-In-Progress:
Tonbandgerät:
-
Support for multicore tracing, including FreeRTOS SMP: Implemented and theoretically (almost?) done, but completely untested. Currently this is limited to cores that share a single, monotonic, time stamp timer.
-
Full FreeRTOS support, including some PRs: PRs are in a draft state/being reviewed. Certain FreeRTOS (rare) are not yet traced correctly due to insufficient tracing hooks. Tracing of streambuffers, direct-to-task notification, timers, and event groups are not yet Implemented.
Other:
- This documentation.
Planned:
Tonbandgerät:
- Post-mortem backend.
- Task stack utilization tracing.
- Multi-core for cores without common timebase.
Other:
- More examples, including a bare-metal project, RTT-backed project, and RP2040 SMP project.
- More example ports.
Getting Started
Installation
Add all source files from tband/src to your project
and place all headers from tband/inc inside a folder
that is available as an include path.
If you are using FreeRTOS, include tband.h at the end of the FreeRTOSConfig.h header:
#ifndef __ASSEMBLER__
#include "tband.h"
#endif
Note
The
__ASSEMBLER__guard is required as some FreeRTOS ports include the header from assembly files.
To use the tracer, only include tband.h in your code. Do not directly include any other Tonbandgerät headers.
Note that Tonbandgerät is written using C11. Older versions of C are not tested.
Porting
Provide a tband_port.h header that implements all required porting macros. Example implementations
can be found here.
Configuration
Provide a tband_config.h header, and configure Tonbandgerät using the configuration macros. Note that you
have to provide this file even if you are keeping all settings at their default value or are providing configuration through
compiler flags.
Trace Handling
Pick a trace handling backend and implement some mechanism for transmitting trace data to the computer.
Porting
Tonbandgerät invokes the macros below for all platform-specific operations. They must all be implemented for Tonbandgerät to function properly!
tband_portTIMESTAMP()
- Required:
YES - Return type:
uint64_t
Get current value of the 64bit unsigned monotonic timestamp timer. The timer should have a
resolution/frequency of tband_portTIMESTAMP_RESOLUTION_NS (see below).
Note that the timer must be shared between all cores. Smaller timers are allowed, but the
return value of this macro should be uint64_t.
Example:
uint64_t platform_ts(void);
#define tband_portTIMESTAMP() platform_ts()
tband_portTIMESTAMP_RESOLUTION_NS
- Required:
YES - Value type:
uint64_t
Resolution of the timestamp timer, in nanoseconds.
Example:
// Timestamp counter increases every 10ns:
#define tband_portTIMESTAMP_RESOLUTION_NS (10)
tband_portENTER_CRITICAL_FROM_ANY()
- Required:
YES
Enter a critical section from any context. For precise details of what properties a critical section must have, see here.
Example:
// FreeRTOS, ARM CM4F:
#define tband_portENTER_CRITICAL_FROM_ANY()            \
  bool tband_port_in_irq = xPortIsInsideInterrupt();   \
  BaseType_t tband_port_key = 0;                       \
  if (tband_port_in_irq) {                             \
    tband_port_key = taskENTER_CRITICAL_FROM_ISR();    \
  } else {                                             \
    taskENTER_CRITICAL();                              \
    (void)tband_port_key;                              \
  }
tband_portEXIT_CRITICAL_FROM_ANY()
- Required:
YES
See tband_portENTER_CRITICAL_FROM_ANY() above.
Example:
// FreeRTOS, ARM CM4F:
#define tband_portEXIT_CRITICAL_FROM_ANY()             \
  if (tband_port_in_irq) {                             \
    taskEXIT_CRITICAL_FROM_ISR(tband_port_key);        \
  } else {                                             \
    taskEXIT_CRITICAL();                               \
  }
tband_portNUMBER_OF_CORES
- Required:
YES - Return type:
uint32_t
Number of cores on which the tracer is running. See Multicore Support for more details.
Example:
// Single core:
#define tband_portNUMBER_OF_CORES (1)
tband_portGET_CORE_ID()
- Required:
YES - Return type:
uint32_t
Detect on which core the current execution context is running. See Multicore Support for more
details. This macro must return a value between 0 and tband_portNUMBER_OF_CORES - 1 inclusive.
Example:
// Single core, always running on core 0:
#define tband_portGET_CORE_ID (0)
Streaming Backend Porting
tband_portBACKEND_STREAM_DATA(buf, len)
- Required:
YES(if streaming backend is enabled) - Return type:
bool - Arg. 1 type:
const uint8_t* - Arg. 2 type:
size_t
Required if the streaming backend is used. Called by Tonbandgerät to
submit data that is to be streamed. Return value of true indicates that data could not
be streamed and was dropped. Return value of false indicates that data was not dropped
and successfully streamed.
Example:
bool stream_data(const uint8_t* buf, size_t buf_len);
#define tband_portBACKEND_STREAM_DATA(buf, len) stream_data(buf, len)
Snapshot Backend Porting
tband_portBACKEND_SNAPSHOT_BUF_FULL_CALLBACK()
- Required:
NO - Return type:
void
If the snapshot backend is active and stops because of a full snapshot buffer, this callback is called.
Note that this macro is called from within the tracing hook of the first event that could not be stored in the buffer, and therefore may be called from any context (interrupts, RTOS tasks, RTOS scheduler, …).
Because the callback is always called from within a Tonbandgerät critical section and while certain internal spin locks are held, no Tonbandgerät APIs may be called from inside this callback.
Even in a multicore setup, this callback is called only once on the one core that first filled its buffer.
Furthermore, note that this callback is called once the (first) buffer is full, but it may take some moments for the snapshot backend to finish, especially on all cores.
Example:
extern volatile bool snapshot_full;
#define tband_portBACKEND_SNAPSHOT_BUF_FULL_CALLBACK() snapshot_full = true
Critical Sections
Motivation
Tonbandgerät tracing hooks can be called from any context - including interrupts. This means Tonbandgerät requires some mechanism for preventing a higher-priority context from accessing internal state or submitting trace events, ensuring there are no race conditions and corrupted trace events.
Implementation Requirements
All sections of Tonbandgerät code that may not be interrupted are wrapped in
tband_portENTER_CRITICAL_FROM_ANY() and tband_portEXIT_CRITICAL_FROM_ANY() guards,
whose platform-specific implementation must be provided by the user as part of the
Tonbandgerät port.
A port must ensure that no tracing events are generated or Tonbandgerät APIs are called while a critical section is active. Precisely how this is to be achieved depends on the overall software design and tracer implementation. A few example scenarios are given below.
Note that critical sections can occur in any context that tracing occurs. If you call tracing APIs in interrupts or are using an RTOS, this may include interrupts! Furthermore, note that Tonbandgerät critical sections do not need to be able to nest, but if used with an RTOS, may be placed inside an RTOS critical section.
Bare-metal Context. No tracing is done in any interrupts.
The critical section does not have to do anything. Since interrupts don’t interact with the tracer, it does not matter if one occurs during a critical section.
Bare-metal Context. Tracing is done in interrupts.
The critical section must disable interrupts. If only a known subset of interrupts generate tracing events or call tracer APIs, the critical section may also selectively disable these interrupts by adjusting interrupt masks or priorities.
RTOS.
RTOS tracing will almost always generate tracing events from interrupts. A critical section must, in this case, disable interrupts and prevent any mechanism for context switching. This is best done by using the critical section API provided by the RTOS. Note that these APIs may have calling semantics that differ from how Tonbandgerät’s critical sections work. For example, FreeRTOS provides separate APIs for critical sections within and outside interrupts, and can only be used if the port supports detecting if execution is currently inside an interrupt. Using the FreeRTOS ARM Cortex M4 port, this may be done as follows:
#include "FreeRTOS.h"
#include "task.h"

#define tband_portENTER_CRITICAL_FROM_ANY()          \
  bool tband_port_in_irq = xPortIsInsideInterrupt(); \
  BaseType_t tband_port_key = 0;                     \
  if (tband_port_in_irq) {                           \
    tband_port_key = taskENTER_CRITICAL_FROM_ISR();  \
  } else {                                           \
    taskENTER_CRITICAL();                            \
    (void)tband_port_key;                            \
  }

#define tband_portEXIT_CRITICAL_FROM_ANY()           \
  if (tband_port_in_irq) {                           \
    taskEXIT_CRITICAL_FROM_ISR(tband_port_key);      \
  } else {                                           \
    taskEXIT_CRITICAL();                             \
  }
Critical Sections & Multi-core Support
No adaptation of a critical section implementation is necessary when moving to a multi-core configuration, as Tonbandgerät protects all static resources that are accessed from multiple cores with spinlocks.
Configuration
Tonbandgerät requires a user-provided tband_config.h header file, where the following configuration
macros can be set:
tband_configENABLE:
- Possible Values:
0, 1 - Default:
0
Set to 1 to enable Tonbandgerät. If disabled, all code is excluded to save space.
Example:
// tband_config.h:
#define tband_configENABLE 1
tband_configMAX_STR_LEN;
- Possible Values:
1+ - Default:
20
Maximum string length that Tonbandgerät will serialize and trace. Serves as a safeguard against incorrectly terminated strings, and helps providing a static upper bound on trace packet size and worst-case trace hook execution time.
tband_configTRACE_DROP_CNT_EVERY:
- Possible Values:
0+ - Default:
50
In addition to sending the dropped event counter after an event was
dropped, Tonbandgerät will also serialize and trace the number of dropped events after every
tband_configTRACE_DROP_CNT_EVERY normal tracing events. Set to zero to disable periodic
dropped event tracing.
tband_configMARKER_TRACE_ENABLE:
- Possible Values:
0, 1 - Default:
1
Set to 0 to disable serialization and tracing of calls to event markers and value markers functions. Can be disabled to reduce the number of generated events.
tband_configISR_TRACE_ENABLE:
- Possible Values:
0, 1 - Default:
1
Set to 0 to disable serialization and tracing of interrupts. Can be disabled to reduce the number of generated events.
Metadata Buffer Config:
tband_configUSE_METADATA_BUF:
- Possible Values:
0, 1 - Default:
1
Enables the metadata buffer if set to 1.
tband_configMETADATA_BUF_SIZE:
- Possible Values:
1+ - Default:
256
Size of the per-core metadata buffer in bytes, if enabled.
Streaming Backend Config:
tband_configUSE_BACKEND_STREAMING:
- Possible Values:
0, 1 - Default:
0
Set to 1 to enable the streaming backend. Note that exactly one backend must be
enabled!
Snapshot Backend Config:
tband_configUSE_BACKEND_SNAPSHOT:
- Possible Values:
0, 1 - Default:
0
Set to 1 to enable the snapshot backend. Note that exactly one backend must be
enabled!
tband_configBACKEND_SNAPSHOT_BUF_SIZE:
- Possible Values:
1+ - Default:
32768
Size of the per-core snapshot buffer in bytes, if enabled.
Post-Mortem Backend Config:
tband_configUSE_BACKEND_POST_MORTEM:
- Possible Values:
0, 1 - Default:
0
Set to 1 to enable the post-mortem backend. Note that exactly one backend must be
enabled!
Warning
The post-mortem backend has not been implemented yet.
External Backend Config:
tband_configUSE_BACKEND_EXTERNAL:
- Possible Values:
0, 1 - Default:
0
Set to 1 to enable the external backend. Note that exactly one backend must be
enabled!
FreeRTOS Tracing Config:
tband_configFREERTOS_TRACE_ENABLE:
- Possible Values:
0, 1 - Default:
0
Set to 1 to enable FreeRTOS tracing.
tband_configFREERTOS_TASK_TRACE_ENABLE:
- Possible Values:
0, 1 - Default:
1
Set to 0 to disable serialization and tracing of FreeRTOS task scheduling and execution. Can be disabled to reduce the number of generated events.
tband_configFREERTOS_QUEUE_TRACE_ENABLE:
- Possible Values:
0, 1 - Default:
1
Set to 0 to disable serialization and tracing of FreeRTOS queue operations. Can be disabled to reduce the number of generated events.
tband_configFREERTOS_STREAM_BUFFER_TRACE_ENABLE:
- Possible Values:
0, 1 - Default:
1
Set to 0 to disable serialization and tracing of FreeRTOS stream buffer operations. Can be disabled to reduce the number of generated events.
Warning
Stream buffers are not yet supported.
Instrumenting Your Code
After Tonbandgerät has been installed, configured, and ported, you can start to collect trace events by instrumenting your code.
These tracing events are split into two main groups. Firstly, there are base tracing events that can be used in any firmware project. These consist of:
Then there are FreeRTOS-specific tracing events:
Event Markers
Event markers are the most basic type of instrumentation. They allow you to quickly and easily trace both instantaneous and span events. Each marker is uniquely identified by a 32-bit, user-selectable ID. Note that markers are global, and can be started/stopped/triggered from any context.
A marker does not have to be initialized to be used, but can optionally be named. They support (strictly) nested span events.
Any instant or (begin of a) span event can feature a string message. Note that long messages require significant tracing resources and are best avoided if not strictly needed.
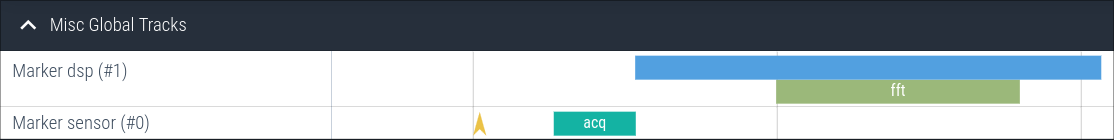
Example
Consider the following (fictional) firmware. An external sensor triggers, once ready, an interrupt. Inside
the handler, a call to the sensor_do_work() function is scheduled, which in turn fetches the data from the sensor
and does some DSP processing involving an FFT.
To gain some insight into the timing and operation of this code, it is instrumented with Tonbandgerät event markers. First, during setup,
the event markers with IDs 0 and 1 are named. In the interrupt, an instant event is traced. In the callback, the
fetching of sensor data and DSP calculation are wrapped in span event markers.
#include "tband.h"

#define MARKER_SENSOR  0
#define MARKER_DSP     1

// Setup:
void setup(void) {
    tband_evtmarker_name(MARKER_SENSOR, "sensor");
    tband_evtmarker_name(MARKER_DSP, "dsp");
}

// Sensor Ready ISR:
void isr(void) {
    tband_evtmarker(MARKER_SENSOR, "rdy");
    schedule_work(sensor_do_work);
}

// Sensor data readout/processing:
void sensor_do_work(void) {
    tband_evtmarker_begin(MARKER_SENSOR, "acq");
    collect_data_from_sensor();
    tband_evtmarker_end(MARKER_SENSOR);

    tband_evtmarker_begin(MARKER_DSP, "");
    dsp1();
    tband_evtmarker_begin(MARKER_DSP, "fft");
    fft();
    tband_evtmarker_end(MARKER_DSP);
    dsp2();
    tband_evtmarker_end(MARKER_DSP);
}
This code above would produce a trace similar to the following:
Configuration
Markers are only traced if the config option tband_configMARKER_TRACE_ENABLE is enabled.
API
tband_evtmarker_name:
void tband_evtmarker_name(uint32_t id, const char *name);
Name the event marker with id id. This is a metadata event. If the metadata buffer is enabled,
it can be emitted at any time before or during the tracing session.
tband_evtmarker:
void tband_evtmarker(uint32_t id, const char *msg);
Trace an instant event.
tband_evtmarker_begin:
void tband_evtmarker_begin(uint32_t id, const char *msg);
Trace the beginning of a span event.
tband_evtmarker_end:
void tband_evtmarker_end(uint32_t id);
Trace the end of a span event.
Value Markers
Value markers allow you to track how a single numeric int64_t value changes over time. Each marker
is uniquely identified by a 32-bit, user-selectable ID. Note that markers are global and can be updated
from any context.
A marker does not have to be initialized to be used, but can optionally be named.
Note
Internally, Tonbandgerät uses a varlen encoding scheme for numeric values, so don’t be appalled by the idea of using a 64-bit trace message to track your 8 bit value. Small values will only require a few bytes.
Example
Consider the following firmware snippet that implements some form of buffer. The functions to add and remove data from the buffer are instrumented with value markers to track how much data the buffer contains at any given time.
#include "tband.h"

#define MARKER_BUF  0

// Setup:
void setup(void) {
    tband_valmarker_name(MARKER_BUF, "buf");
}

// Add bytes to buffer:
void add_to_buf(struct buf *b, const uint8_t *data, size_t len) {
    tband_valmarker(MARKER_BUF, buf.len + len);
    // ...
}

// Read & remove bytes from buffer:
void remove_from_buf(struct buf *b, uint8_t *data, size_t len) {
    tband_valmarker(MARKER_BUF, buf.len - len);
    // ...
}
A trace of this imaginary firmware would look like this:

Configuration
Markers are only traced if the config option tband_configMARKER_TRACE_ENABLE is enabled.
API
tband_valmarker_name:
void tband_valmarker_name(uint32_t id, const char *name);
Name the value marker with id id. This is a metadata event. If the metadata buffer is enabled,
it can be emitted at any time before or during the tracing session.
tband_valmarker:
void tband_valmarker(uint32_t id, int64_t val);
Trace a new value.
Interrupts
Interrupts can be traced with an API that is rather similar to normal general purpose value markers. They are also identified by a 32-bit ID, and can optionally be named but don’t otherwise require any kind of configuration.
Note that unlike event markers, they are local to one core. If two cores share an interrupt, you will have to name it on both cores.
Tip
Tracing of frequent interrupts may require significant resources.
Example
In the example below, an interrupt routine is being traced:
#include "tband.h"

#define TICK_ISR_ID 0

// Setup:
void setup(void) {
    tband_isr_name(TICK_ISR_ID, "tick");
}

void systick_isr(void) {
    tband_isr_enter(TICK_ISR_ID);
    // ...
    tband_isr_exit(TICK_ISR_ID);
}
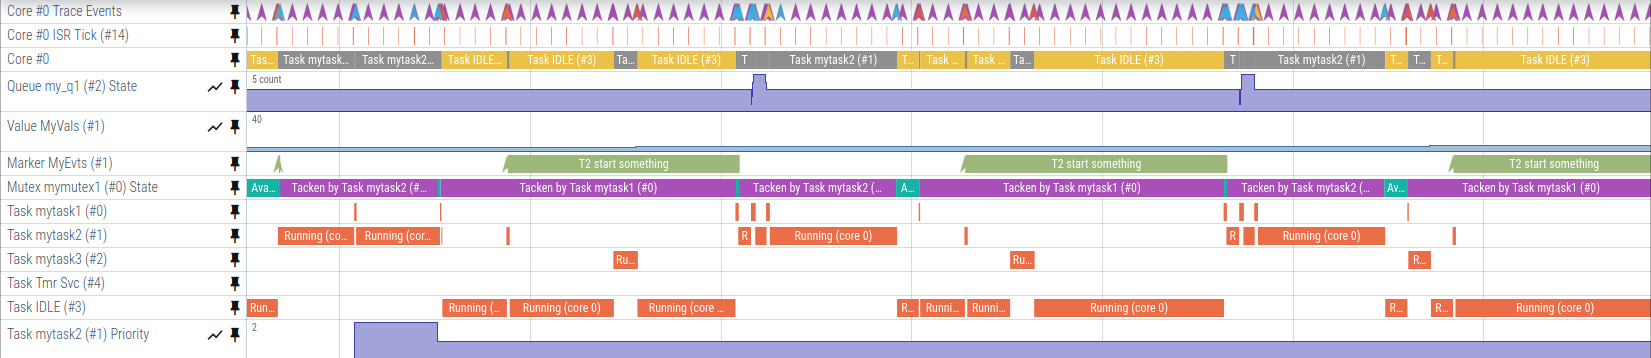
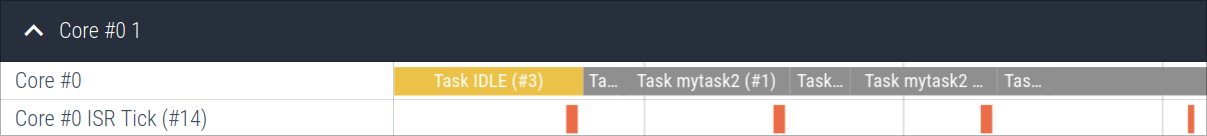
ISRs are visualized next to the core they are associated with. The example
below shows a trace of the SysTick interrupt while FreeRTOS is running:
Configuration
Interrupts are only traced if the config option tband_configISR_TRACE_ENABLE is enabled.
API
tband_isr_name:
void tband_isr_name(uint32_t id, const char *name);
Name the interrupt with id id. This is a metadata event. If the metadata buffer is enabled,
it can be emitted at any time before or during the tracing session.
tband_isr_enter:
void tband_isr_enter(uint32_t id);
Trace the beginning of an interrupt.
tband_isr_exit:
void tband_isr_exit(uint32_t id);
Trace the end of an interrupt.
FreeRTOS Tracing
Tonbandgerät supports automatic tracing of FreeRTOS task scheduling and resource operations by hooking into FreeRTOS’s built-in trace facility.
Warning
FreeRTOS tracing is functional but still in active development. Some FreeRTOS features, including stream buffers, software timers, event groups, and direct-to-task notifications, are not yet traced. See Limitations below.
Overview
When FreeRTOS tracing is enabled, Tonbandgerät installs itself into FreeRTOS’s
trace hook macros (traceTASK_SWITCHED_IN, traceQUEUE_SEND, etc.) by
including tband.h from FreeRTOSConfig.h. No manual instrumentation is
needed for automatic events. Task switches, queue operations, priority
changes, and more are all recorded without any changes to application code.
A small number of manual API calls are still required to give resources names that appear in the viewer, and to notify the tracer once the scheduler has started.
Required FreeRTOS Configuration
The following options must be set in FreeRTOSConfig.h:
// Required for Tonbandgerät to access task/queue ID fields:
#define configUSE_TRACE_FACILITY    1

// Required to identify the idle task(s) at startup:
#define INCLUDE_xTaskGetIdleTaskHandle  1
Tonbandgerät will produce a compile-time error if either of these is missing.
Tonbandgerät Configuration
Enable FreeRTOS tracing in tband_config.h:
#define tband_configFREERTOS_TRACE_ENABLE 1
Three sub-options control which categories of events are recorded. All default
to 1 (enabled) and can be set to 0 to reduce the number of generated
events:
// Task scheduling events (switches, delays, priority changes, ...):
#define tband_configFREERTOS_TASK_TRACE_ENABLE 1

// Queue/semaphore/mutex operations (send, receive, reset, ...):
#define tband_configFREERTOS_QUEUE_TRACE_ENABLE 1
Even with tband_configFREERTOS_TASK_TRACE_ENABLE disabled, tasks are still
assigned internal IDs and their names are still stored in the metadata
buffer. Similarly, with
tband_configFREERTOS_QUEUE_TRACE_ENABLE disabled, queues are still assigned
IDs. Only the dynamic operation events are suppressed.
Integration
Include tband.h at the end of FreeRTOSConfig.h:
// FreeRTOSConfig.h (at the end of the file):
#ifndef __ASSEMBLER__
#include "tband.h"
#endif
This installs all FreeRTOS trace hooks automatically.
Tip
The
__ASSEMBLER__guard is required because some FreeRTOS ports includeFreeRTOSConfig.hfrom assembly files.
Manual API Calls
tband_freertos_scheduler_started()
Call this once, immediately after vTaskStartScheduler():
vTaskStartScheduler();
tband_freertos_scheduler_started();
This records which tasks are the idle task(s) and, if
configUSE_TIMERS == 1, which task is the FreeRTOS timer daemon. Without this
call, those tasks will appear as unnamed and unlabelled in the viewer. This
information is emitted as metadata and stored in the
metadata buffer even before tracing is started.
Note
Future versions of FreeRTOS include a
traceSCHEDULER_STARTEDhook that will allow this to happen automatically. Until then, the manual call is required.
Resource Naming
Queues, semaphores, and mutexes can optionally be given names that appear in the trace viewer. These are metadata events and can be called at any point after the resource is created, even if tracing is not currently active:
tband_freertos_queue_name(handle, name);
tband_freertos_binary_semaphore_name(handle, name);
tband_freertos_counting_semaphore_name(handle, name);
tband_freertos_mutex_name(handle, name);
tband_freertos_recursive_mutex_name(handle, name);
See FreeRTOS Resource Tracing for details.
Internal Use of FreeRTOS APIs
Warning
Tonbandgerät uses two FreeRTOS fields that are provided specifically for trace facilities. Your application code must not use these APIs, or it will corrupt the tracer’s internal ID assignments and produce an invalid trace:
vTaskSetTaskNumber()/uxTaskGetTaskNumber(): Tonbandgerät stores its internal task ID in each task’suxTaskNumberfield.vQueueSetQueueNumber()/uxQueueGetQueueNumber(): Tonbandgerät stores its internal queue ID in each queue’suxQueueNumberfield.These fields are set automatically when a task or queue is created and read by every subsequent trace hook. Overwriting them from application code will cause all subsequent events for that task or queue to be attributed to the wrong resource in the viewer.
Known Limitations
The following FreeRTOS features are not yet traced:
- Stream buffers and message buffers:
tband_configFREERTOS_STREAM_BUFFER_TRACE_ENABLEexists as a config option but the underlying implementation is not yet complete. - Software timers: timer callbacks are not traced as distinct events.
- Event groups: not traced.
- Direct-to-task notifications: not traced.
FreeRTOS Task Tracing
When tband_configFREERTOS_TASK_TRACE_ENABLE is enabled (the default),
Tonbandgerät automatically traces FreeRTOS task scheduling events via the
FreeRTOS trace hook macros. No changes to application task code are needed.
Internal Use of uxTaskNumber
Warning
Tonbandgerät uses the
uxTaskNumberfield of each FreeRTOS task control block to store its internal task ID. This field is set automatically viavTaskSetTaskNumber()when a task is created, and read by every subsequent task-related trace hook.Do not call
vTaskSetTaskNumber()oruxTaskGetTaskNumber()anywhere in your application code. Doing so will overwrite the tracer’s ID assignment and cause all subsequent events for that task to be misattributed in the trace viewer.
Task IDs
Every task is assigned a unique, monotonically increasing integer ID the moment
it is created (traceTASK_CREATE). This ID is used to identify the task in
all subsequent trace events. ID 0 is reserved and never assigned to a user
task.
Task names are always recorded as metadata when a task is
created, regardless of whether tband_configFREERTOS_TASK_TRACE_ENABLE is on.
The idle task(s) and timer daemon task are identified as such when
tband_freertos_scheduler_started() is called. See the FreeRTOS Tracing
overview for details. Since such events
are considered metadata, this is also tracked if tracing is not yet enabled.
Configuration
Task tracing can be disabled independently of queue tracing:
#define tband_configFREERTOS_TASK_TRACE_ENABLE 0
When disabled, tasks are still assigned IDs and their names are still stored in the metadata buffer, so they remain identifiable if any other events reference them. Only the dynamic scheduling events listed above are suppressed.
FreeRTOS Trace Hooks
The following task scheduling events are recorded automatically:
| FreeRTOS Hook | What it records |
|---|---|
traceTASK_SWITCHED_IN | The task that is about to start running on this core |
traceMOVED_TASK_TO_READY_STATE | A task has been moved to the ready state |
traceTASK_RESUME | A task has been resumed (from task context) |
traceTASK_RESUME_FROM_ISR | A task has been resumed from an ISR |
traceTASK_SUSPEND | A task has been suspended |
traceTASK_DELAY | The current task called vTaskDelay() |
traceTASK_DELAY_UNTIL | The current task called vTaskDelayUntil() |
traceTASK_PRIORITY_SET | A task’s priority was explicitly changed |
traceTASK_PRIORITY_INHERIT | A task inherited a higher priority from a mutex holder |
traceTASK_PRIORITY_DISINHERIT | A task’s inherited priority was restored |
traceTASK_DELETE | A task was deleted |
traceBLOCKING_ON_QUEUE_SEND | The current task is about to block waiting to send to a queue |
traceBLOCKING_ON_QUEUE_RECEIVE | The current task is about to block waiting to receive from a queue |
traceBLOCKING_ON_QUEUE_PEEK | The current task is about to block waiting to peek a queue |
The blocking-on-queue events are included here under task tracing because they describe task state changes, even though they also reference a queue ID.
FreeRTOS Resource Tracing
Tonbandgerät traces the creation and operation of FreeRTOS queues, semaphores, and mutexes. All of these are internally represented as queues in FreeRTOS, and Tonbandgerät treats them the same way: each gets a unique ID, an optional name, and its operation events are recorded in the trace.
Internal Use of uxQueueNumber
Warning
Tonbandgerät uses the
uxQueueNumberfield of each FreeRTOS queue control block to store its internal queue ID. This field is set automatically viavQueueSetQueueNumber()when a queue (or semaphore or mutex) is created, and read by every subsequent queue-related trace hook.Do not call
vQueueSetQueueNumber()oruxQueueGetQueueNumber()anywhere in your application code. Doing so will overwrite the tracer’s ID assignment and cause all subsequent events for that resource to be misattributed in the trace viewer.
Every queue, semaphore, or mutex is assigned a unique, monotonically increasing
integer ID the moment it is created (traceQUEUE_CREATE). This ID is used to
identify the resource in all subsequent trace events. ID 0 is reserved and
never assigned.
Naming Resources
Queues, semaphores, and mutexes are anonymous by default. Giving them names makes traces significantly easier to read. Names are stored in the metadata buffer and can be set at any time after the resource is created, even before the trace collection has started:
tband_freertos_queue_name(handle, name);
tband_freertos_binary_semaphore_name(handle, name);
tband_freertos_counting_semaphore_name(handle, name);
tband_freertos_mutex_name(handle, name);
tband_freertos_recursive_mutex_name(handle, name);
Example:
QueueHandle_t uart_queue = xQueueCreate(16, sizeof(char));
tband_freertos_queue_name(uart_queue, "uart_rx");

SemaphoreHandle_t spi_mutex = xSemaphoreCreateMutex();
tband_freertos_mutex_name(spi_mutex, "spi_bus");
Configuration
Queue/resource operation tracing can be disabled independently of task tracing:
#define tband_configFREERTOS_QUEUE_TRACE_ENABLE 0
When disabled, resources are still assigned IDs (via traceQUEUE_CREATE,
which always runs), so they remain identifiable. The queue kind and initial
fill level are not recorded, and all send/receive/reset events are suppressed.
FreeRTOS Trace Hooks
Creation
| FreeRTOS Hook | What it records |
|---|---|
traceQUEUE_CREATE | A queue, sempaphore, mutex etc was created |
When any queue, semaphore, or mutex is created, Tonbandgerät records:
- The creation event and assigned ID
- The resource kind (queue, binary semaphore, counting semaphore, mutex, or recursive mutex)
- The initial fill level (always 0 for queues and mutexes; the initial count for counting semaphores)
These are metadata events and are stored in the metadata buffer.
Operations
The following events are recorded automatically during operation.
| FreeRTOS Hook | What it records |
|---|---|
traceQUEUE_SEND | An item was sent to a queue (from task context) |
traceQUEUE_SEND_FROM_ISR | An item was sent to a queue (from ISR) |
traceQUEUE_RECEIVE | An item was received from a queue (from task context) |
traceQUEUE_RECEIVE_FROM_ISR | An item was received from a queue (from ISR) |
traceQUEUE_RESET | A queue was reset to its empty state |
FreeRTOS Task-local Markers
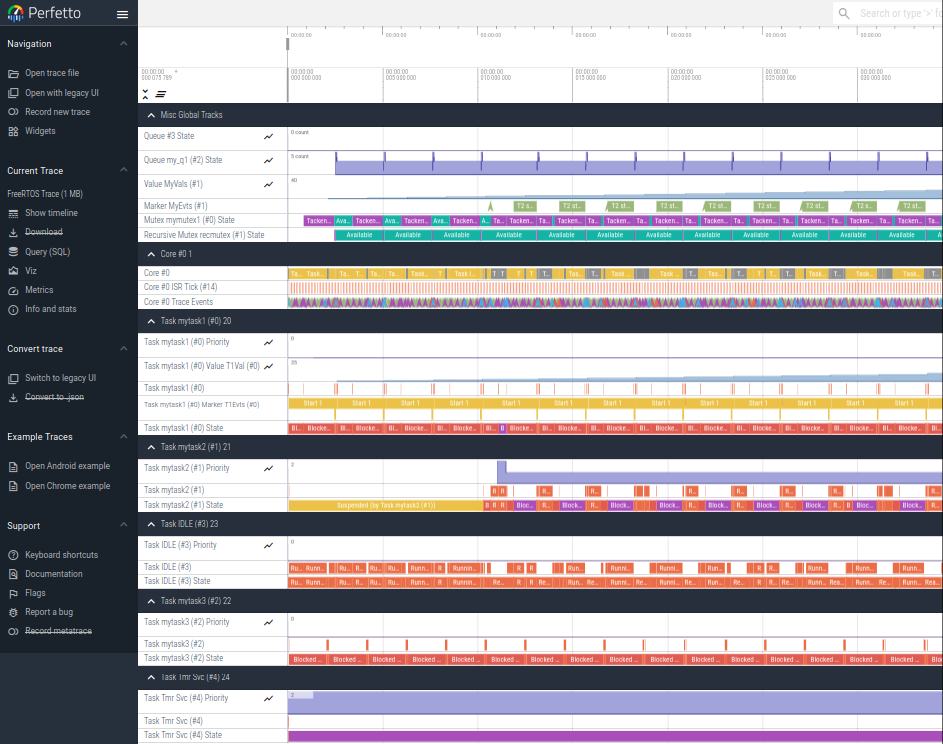
Task-local markers are event and value markers that are associated with the currently running task rather than appearing as a global track in the viewer. In Perfetto, they show up as nested rows inside the task’s own timeline, making it easy to see what a specific task was doing at any point during its execution.
They are otherwise identical to regular event markers and value markers in usage and semantics.
Requirement
Task-local markers require both FreeRTOS tracing and marker tracing to be enabled:
#define tband_configFREERTOS_TRACE_ENABLE 1
#define tband_configMARKER_TRACE_ENABLE   1
How They Differ from Global Markers
A regular tband_evtmarker(id, msg) call produces an event on a global track
that is visible across the entire trace, independent of which task was running.
A tband_freertos_task_evtmarker(id, msg) call produces the same event but
tags it with the ID of the currently running task. The viewer places this event
inside that task’s timeline. The marker ID is scoped to the task: two
different tasks can use the same marker ID without conflict, and their events
will appear on separate per-task tracks.
Note
Task-local markers must only be called from task context, not from ISRs or from before the scheduler has started. The implementation reads the current task’s ID via FreeRTOS internals to determine ownership.
API
Event Markers
// Name a task-local event marker track. Metadata event.
void tband_freertos_task_evtmarker_name(uint32_t id, const char *name);

// Trace an instant event on the current task's marker track.
void tband_freertos_task_evtmarker(uint32_t id, const char *msg);

// Trace the beginning of a span event on the current task's marker track.
void tband_freertos_task_evtmarker_begin(uint32_t id, const char *msg);

// Trace the end of a span event on the current task's marker track.
void tband_freertos_task_evtmarker_end(uint32_t id);
Value Markers
// Name a task-local value marker track. Metadata event.
void tband_freertos_task_valmarker_name(uint32_t id, const char *name);

// Trace a numeric value on the current task's value marker track.
void tband_freertos_task_valmarker(uint32_t id, int64_t val);
Example
#define MARKER_WORK  0

void my_task(void *arg) {
    tband_freertos_task_evtmarker_name(MARKER_WORK, "processing");

    for (;;) {
        wait_for_data();

        tband_freertos_task_evtmarker_begin(MARKER_WORK, "");
        do_work();
        tband_freertos_task_evtmarker_end(MARKER_WORK);
    }
}
In the viewer, the processing span will appear as a nested row inside
my_task’s timeline, alongside the task’s scheduling events.
Trace Backends
When Tonbandgerät generates a trace event (a task switch, a marker firing, a queue operation, …) it serializes it into a compact binary representation and immediately hands it off to the active backend. The backend is responsible for deciding what to do with those bytes: store them in a buffer, stream them over a wire, or hand them to custom user code.
Exactly one backend must be enabled at compile time. Enabling zero or more than one is a compile-time error.
Available Backends
Streaming
The streaming backend forwards every trace event to a user-provided hook
(tband_portBACKEND_STREAM_DATA) the moment it is generated. It is suitable
for live tracing over interfaces that can keep up, such as SEGGER RTT.
Because the hook is called from within a critical section and may be invoked from any context including ISRs and the RTOS kernel, the implementation is subject to strict constraints: it must be non-blocking and must complete immediately. See the Streaming Backend documentation for details.
Enable with:
#define tband_configUSE_BACKEND_STREAMING 1
Snapshot
The snapshot backend accumulates trace events into a statically allocated, per-core buffer until it fills up, then stops. The contents can be read out and transmitted at any convenient time after recording has finished. No real-time constraints apply during transmission.
This is the simplest and most robust backend for most use cases.
Enable with:
#define tband_configUSE_BACKEND_SNAPSHOT 1
External
The external backend lets you provide your own implementation of the internal
tband_submit_to_backend function, bypassing all of Tonbandgerät’s built-in
backend machinery.
Warning
It is unlikely that you want to use this backend! Consider using the streaming backend instead.
All backend responsibilities (start/stop control, thread safety, metadata handling) fall entirely on the user. See the External Backend documentation for details and warnings.
Enable with:
#define tband_configUSE_BACKEND_EXTERNAL 1
Post-Mortem
Warning
The post-mortem backend has not been implemented yet.
Enable with:
#define tband_configUSE_BACKEND_POST_MORTEM 1
The Metadata Buffer
Motivation
Some trace events describe the static structure of the firmware rather than dynamic events: the name of a FreeRTOS task, the kind of a queue, the name of an event marker track, the timestamp timer resolution. These are called metadata events.
The problem is that these events are naturally generated very early: Tasks are created and named during startup, marker names are set during initialisation, etc. Often, this takes place long before tracing begins. If the backend is not yet active at that point, those events are lost and the trace will show unnamed tasks, anonymous queues, and so on.
The metadata buffer solves this by accumulating all metadata events into a statically allocated, per-core buffer regardless of whether the backend is currently active. When the backend is later started, the metadata buffer contents can be transmitted first to ensure the converter has all the information it needs.
Note
The metadata buffer is designed for typical small emebedded firmwares that do not dynamically create and destroy an unbounded set of resources. Because the size of the metadata buffer is statically bounded, such a firmware will inevitably overflow it.
Warning
🚧 The metadata buffer detects overflows but currently this information is not reported anywhere. 🚧
TODO(schilkp)
Configuration
The metadata buffer is enabled by default:
#define tband_configUSE_METADATA_BUF 1
Set to 0 to disable it. If disabled, any metadata events generated while the
backend is inactive are permanently lost.
The size of each per-core metadata buffer (in bytes) is configured with:
#define tband_configMETADATA_BUF_SIZE 256
The default is 256 bytes. See Sizing the Buffer below.
Which Events Are Stored
Take a look at the list of all tracing events for the definite reference of events are considered metadata.
Roughly speaking, the following events are considered metadata and are stored in the buffer:
- Timestamp timer resolution (
tband_gather_system_metadata()) - ISR names (
tband_isr_name) - Event marker names (
tband_evtmarker_name) - Value marker names (
tband_valmarker_name) - FreeRTOS task names and types (task name, idle task, timer task)
- FreeRTOS queue names and kinds
Dynamic events (task switches, queue sends/receives, marker firings, ISR enter/exit) are not metadata and are not stored in the buffer.
API
tband_get_metadata_buf()
Get a pointer to a core’s metadata buffer.
Prototype:
const volatile uint8_t *tband_get_metadata_buf(unsigned int core_id);
Returns a pointer to the raw metadata buffer for the given core. The buffer is statically allocated and its address does not change.
tband_get_metadata_buf_amnt()
Get the number of valid bytes in a core’s metadata buffer.
Prototype:
size_t tband_get_metadata_buf_amnt(unsigned int core_id);
Returns the number of bytes currently stored in the metadata buffer for the given core. This value can be read at any time.
Backend Integration
How the metadata buffer is used depends on which backend is active.
Streaming Backend
tband_start_streaming() automatically transmits the metadata buffer contents
for all cores before enabling event streaming. No manual handling is required.
Snapshot Backend
The metadata buffer is not automatically included in the snapshot. After a snapshot has been collected, both the metadata buffer and the snapshot buffer must be transmitted to produce a valid trace. See the snapshot backend documentation for a worked example.
Sizing the Buffer
Each metadata event occupies a small number of bytes in the buffer. Name events
consist of a few bytes of overhead plus the length of the name string (up to
tband_configMAX_STR_LEN). A few representative sizes with the default
tband_configMAX_STR_LEN of 20:
| Event type | Approximate size |
|---|---|
| Timestamp resolution | up to 11 bytes |
| ISR / marker / queue name | up to ~28 bytes |
| Task name | up to ~28 bytes |
| Queue kind | ~3 bytes |
The buffer needs to be large enough to hold all metadata events that will ever be generated. This is well-bounded as long as the set of tasks, queues, interrupts, and markers with names is fixed: a buffer of 256 bytes comfortably covers a handful of named resources with short names, but a project with many tasks and queues may need a larger buffer.
Warning
🚧 The metadata buffer detects overflows but currently this information is not reported anywhere. 🚧 If the metadata buffer overflows, the excess events are silently discarded. The internal
did_ovfflag is set but is not currently reported or surfaced through any API. If your trace is missing names for some resources, increasetband_configMETADATA_BUF_SIZE.TODO(schilkp)
The STREAMING Backend
The streaming backend transmits trace data in real-time as events occur. Each trace event is immediately passed to a user-provided function for transmission, making it suitable for live tracing over serial ports, debug ports, etc.
Overview
When the streaming backend is active, every trace event is serialized and
immediately forwarded to the tband_portBACKEND_STREAM_DATA hook for
transmission, which must be provided.
If the metadata buffer is enabled, its contents are automatically transmitted when streaming is started.
Configuration
Enable the streaming backend in tband_config.h:
#define tband_configUSE_BACKEND_STREAMING 1
Note that exactly one backend must be enabled. See Configuration for details.
Required Porting
When using the streaming backend, you must implement the
tband_portBACKEND_STREAM_DATA macro in your tband_config.h or
tband_port.h file.
tband_portBACKEND_STREAM_DATA(buf, len)
- Arg. 1: (type:
const uint8_t*) buffer containing the trace event to transmit. - Arg. 2: (type:
size_t) length of the event in the buffer.
Return value:
true- Data could not be transmitted and was droppedfalse- Data was successfully transmitted
This hook is called by Tonbandgerät for every trace event that is generated.
Tip
Tonbandgerät will only attempt to transmit any given trace event once. If the
tband_portBACKEND_STREAM_DATAhook returns true, indicating the event was dropped, Tonbandgerät will drop the event and increment the internal dropped- event counter. This causes Tonbandgerät to generate droppped-event marker events, which are generated until one was able to be streamed/submitted sucessfully.
Warning
This hook is called from within tracing hooks, and from within critical sections. These hooks may be called from any context, such as an RTOS kernel or interrupts, depending on your implementation and usage of Tonbandgerät.
This limits your ability to call RTOS APIs, or perform any kind of blocking operation. Doing so might not work, or even worse, might cause some very strange and hard to track-down behaviour.
Consider using a communication port specifically designed for such scenarios (such as SEGGER’s RTT), or use this hook to place data into some form of static buffer that is processed asynchronously.
Example:
bool stream_data(const uint8_t* buf, size_t len);
#define tband_portBACKEND_STREAM_DATA(buf, len) stream_data(buf, len)
API Functions
tband_start_streaming()
Start streaming trace data.
Prototype:
int tband_start_streaming(void);
Return values:
0- Streaming started successfully-1- Streaming is already active-2- Failed to transmit metadata buffer contents (if metadata buffer is enabled)
If the metadata buffer is enabled, this function automatically transmits the metadata buffer contents for all cores before enabling trace event streaming. This ensure all the trace events generated during resource setup (such as names/types of queues, tasks, etc) are transmitted for a proper trace, even if streaming is not enabled at that time.
tband_stop_streaming()
Stop streaming trace data.
Prototype:
int tband_stop_streaming(void);
Return values:
0- Streaming stopped successfully-1- Streaming was not active
After calling this function, trace events will no longer be transmitted. The
function returns immediately; some events may still be in flight on individual
cores. Use tband_tracing_finished() to check when all cores have completed.
Example:
tband_stop_streaming();

// Wait for all backends to finish processing
while (!tband_tracing_finished()) {
    // Wait
}
Multi-core Considerations
In multi-core systems, each core independently calls
tband_portBACKEND_STREAM_DATA for its trace events. The implementation should
handle concurrent calls from multiple cores safely.
Metadata Buffer Integration
If the metadata buffer is enabled
(tband_configUSE_METADATA_BUF), metadata events (like marker names and ISR
names) are stored in the per-core metadata buffers and automatically
transmitted when tband_start_streaming() is called.
Metadata for all cores is transmitted before regular trace event streaming begins.
The SNAPSHOT Backend
The snapshot backend records trace events into a statically allocated, per-core buffer until it fills up, then stops tracing automatically. This makes it the simplest backend to use: there is no need to handle trace data in real-time, and the buffer can be read out and transmitted at any point with any interface after recording has finished.
Overview
When the snapshot backend is active, every trace event is appended to an
internal, per-core buffer of size tband_configBACKEND_SNAPSHOT_BUF_SIZE.
Once a buffer fills up, tracing stops globally and the optional
tband_portBACKEND_SNAPSHOT_BUF_FULL_CALLBACK hook is invoked to notify your
code that recording has completed.
The buffer can then be read out and transmitted to the host over any interface (UART, USB, a debugger).
If the metadata buffer is enabled, its contents must be transmitted alongside the snapshot buffer to produce a valid trace. See Retrieving the Trace below.
If tonbandgeraet is used in a multi-core configuration, the
tband_portBACKEND_SNAPSHOT_BUF_FULL_CALLBACK is called on the core which
first fills it’s buffer. While this immediately signals to all other cores to
stop finishing tracing, other cores might take a short while to finish processing
any tracing events that are already in flight. Use tband_tracing_finished to
check whether all cores have finished before transmitting all snapshot buffers.
Configuration
Enable the snapshot backend in tband_config.h:
#define tband_configUSE_BACKEND_SNAPSHOT 1
Note that exactly one backend must be enabled. See Configuration for details.
The size of each per-core snapshot buffer (in bytes) is configured with:
#define tband_configBACKEND_SNAPSHOT_BUF_SIZE 32768
The default is 32768 bytes. In multi-core configurations, one independent buffer of this size is allocated per core.
Optional Porting
tband_portBACKEND_SNAPSHOT_BUF_FULL_CALLBACK()
- Required:
NO
If defined, this macro is called when the snapshot buffer fills up and tracing stops. It provides a way to signal the rest of your application that recording is complete.
Warning
This callback is invoked from within the tracing hook of the first event that could not be stored, and therefore may be called from any context (application code, interrupts, the RTOS scheduler, …). No FreeRTOS APIs may be called from inside this callback
It is called from within a Tonbandgerät critical section while internal spinlocks are held. No Tonbandgerät APIs may be called from inside this callback.
Note
In a multi-core setup, this callback is called exactly once on whichever core first fills its buffer. Other cores may still be in the process of writing their last event when the callback fires. Use
tband_tracing_finished()to determine when all cores have fully stopped.
Example:
extern volatile bool snapshot_done;
#define tband_portBACKEND_SNAPSHOT_BUF_FULL_CALLBACK() snapshot_done = true

// For example, in systick handler:
void systick_irq() {
    // ...
    if (snapshot_done) {
        if (tband_tracing_finished()) {
            signal_that_trace_is_done_to_tx_task();
            snapshot_done = false;
        }
    }
}
API Functions
tband_trigger_snapshot()
Start recording a snapshot.
Prototype:
int tband_trigger_snapshot(void);
Return values:
0: Snapshot started successfully-1: Tracing is already active
Enables the snapshot backend. Trace events will be appended to the per-core buffers until they fill up, at which point tracing stops automatically.
Tip
The metadata buffer, if enabled, accumulates metadata events independently of the backend state.
tband_stop_snapshot()
Stop recording before the buffer fills up.
Prototype:
int tband_stop_snapshot(void);
Return values:
0: Stopped successfully-1: Tracing was not active
Manually halts snapshot recording.
After calling this function, some events may still be in flight on individual
cores. Use tband_tracing_finished() to confirm that all cores have stopped
before reading the buffers.
Example:
tband_stop_snapshot();

while (!tband_tracing_finished()) {
    // Wait for all cores to finish
}
tband_reset_snapshot()
Clear the snapshot buffers so a new snapshot can be recorded.
Prototype:
int tband_reset_snapshot(void);
Return values:
0: Buffers cleared successfully-1: Tracing is still active
Resets the write index of all per-core snapshot buffers to zero. Must only be
called after tracing has fully stopped (i.e., after tband_tracing_finished()
returns true). After a successful reset, tband_trigger_snapshot() can be
called again to record a fresh snapshot.
tband_get_core_snapshot_buf()
Get a pointer to a core’s snapshot buffer.
Prototype:
const volatile uint8_t *tband_get_core_snapshot_buf(unsigned int core_id);
Returns a pointer to the raw snapshot buffer for the given core. The buffer is statically allocated and its address does not change.
Note
Always wait until
tband_tracing_backend_finished(core_id)returnstruebefore reading a core’s buffer.
Note
The amount of valid data in a specific buffer that should be transmitted is given by
tband_get_core_snapshot_buf_amnt().
tband_get_core_snapshot_buf_amnt()
Get the number of valid bytes in a core’s snapshot buffer.
Prototype:
size_t tband_get_core_snapshot_buf_amnt(unsigned int core_id);
Returns the number of bytes that have been written to the snapshot buffer for
the given core. Returns 0 if that core’s backend has not yet finished.
Wait for tband_tracing_backend_finished(core_id) or tband_tracing_finished()
before using this value.
Retrieving the Trace
Once tracing has stopped, you need to transmit two pieces of data to the host for each core to produce a valid trace:
- The metadata buffer (if
tband_configUSE_METADATA_BUFis enabled) contains names of tasks, queues, markers, etc. that were generated before or during the snapshot. Retrieved withtband_get_metadata_buf()andtband_get_metadata_buf_amnt(). - The snapshot buffer contains the recorded trace events. Retrieved
with
tband_get_core_snapshot_buf()andtband_get_core_snapshot_buf_amnt().
The metadata buffer contents should be transmitted before the snapshot data so that the converter can resolve all names correctly.
Example:
// Wait for all backends to finish
while (!tband_tracing_finished()) {
    // Spin or yield
}

for (unsigned int core = 0; core < tband_portNUMBER_OF_CORES; core++) {

    // Transmit metadata buffer (if enabled)
    size_t meta_len = tband_get_metadata_buf_amnt(core);
    if (meta_len > 0) {
        const volatile uint8_t *meta_buf = tband_get_metadata_buf(core);
        transmit(meta_buf, meta_len);
    }

    // Transmit snapshot buffer
    size_t snap_len = tband_get_core_snapshot_buf_amnt(core);
    if (snap_len > 0) {
        const volatile uint8_t *snap_buf = tband_get_core_snapshot_buf(core);
        transmit(snap_buf, snap_len);
    }
}
Tip
Because the snapshot buffer is static and transmission does not have to be real-time, this is a good place to use blocking I/O such as a simple blocking UART write, a USB bulk transfer, or even copying the buffer out over a debugger. As long as you take care with what you call in the
tband_configBACKEND_SNAPSHOT_BUF_FULL_CALLBACKto signal to your code that the data is ready, you can then use whatever is easiest to transmit.
Multi-core Considerations
In a multi-core configuration, each core records into its own independent
buffer of tband_configBACKEND_SNAPSHOT_BUF_SIZE bytes.
Tracing stops globally as soon as any core’s buffer fills. The
tband_portBACKEND_SNAPSHOT_BUF_FULL_CALLBACK callback is invoked exactly
once, on the core that triggered the stop. Other cores may still finish writing
their current event before they notice that tracing has been disabled. Use
tband_tracing_finished() to wait for all of them before reading any buffer.
To retrieve data for all cores, iterate over each core_id from 0 to
tband_portNUMBER_OF_CORES - 1 and use tband_tracing_backend_finished(),
tband_get_core_snapshot_buf(), and tband_get_core_snapshot_buf_amnt() for
each.
The POST_MORTEM Backend
Warning
This backend has not yet been implemented.
The EXTERNAL Backend
The external backend is an escape hatch. It lets you replace Tonbandgerät’s entire backend implementation with your own by providing a single function. All of the machinery that the streaming and snapshot backends handle automatically (start/stop control, thread safety, metadata buffer integration, dropped event protection) is bypassed and your responsibility.
Only use this backend if you have a specific need that the built-in backends cannot satisfy and you understand the constraints involved.
Configuration
Enable the external backend in tband_config.h:
#define tband_configUSE_BACKEND_EXTERNAL 1
Note that exactly one backend must be enabled. See Configuration for details.
What to Implement
You must provide a definition of the following function:
bool tband_submit_to_backend(uint8_t *buf, size_t len, bool is_metadata);
buf: pointer to a buffer containing one serialized trace event.len: length of the event in the buffer.is_metadata:trueif this event is a metadata event (a task name, queue kind, marker name, etc.).falsefor all other events.
Return value:
false: the event was accepted successfully.true: the event was dropped. Tonbandgerät will increment its internal dropped event counter and attempt to report the drop in the next trace event.
This function is called by Tonbandgerät for every trace event that is generated on every core, unconditionally.
Warnings
Warning
This function is called from within a Tonbandgerät critical section, from any context. Depending on your port and instrumentation, this includes ISR handlers, the FreeRTOS scheduler, and FreeRTOS kernel internals.
This means your implementation must complete immediately and must not:
- Call any RTOS API (queue sends, semaphore gives, task notifications, …)
- Block or busy-wait on any condition
- Call any Tonbandgerät API
Warning
There is no start/stop control. The streaming and snapshot backends gate event delivery behind a global
tracing_enabledflag that is managed through their respective APIs (tband_start_streaming(),tband_trigger_snapshot(), etc.). None of this exists for the external backend. Yourtband_submit_to_backendwill be called for every event from the moment any tracing hook first fires. If you want to only record during a specific window, you must implement that logic yourself.
Warning
The functions
tband_tracing_enabled()andtband_tracing_finished()will not reflect your backend’s state, as they track the internal flag that only the built-in backends manage.
Warning
There is no automatic metadata buffer integration. The snapshot and streaming backends transparently accumulate metadata events into a per-core metadata buffer and handle transmitting its contents at the right time. With the external backend, all of that is gone. The
is_metadataargument tells you whether a given event is metadata, but what you do with that information (if anything) is entirely up to you.
Warning
There is no automatic thread safety. The built-in backends protect their internal state with per-core spinlocks to guarantee correct behavior in multicore configurations. If you access shared state from
tband_submit_to_backend, you are responsible for synchronizing access correctly, keeping in mind that it may be called concurrently from multiple cores.
Dropped Events
Overview
Some backends, such as the streaming backend implementation, may fail to transmit a trace event due to bandwidth limits or other breakdowns.
To handle such cases, Tonbandgerät backends can signal to the trace handling core that an individual trace event could not be submitted and traced.
Because Tonbandgerät buffering and re-transmitting suche events could both significantly slow down the firmware and make the time required to complete an individual trace hook even more unpredictable, no effort is made to ensure all events are actually transmitted.
However, Tonbandgerät does track such dropped events and ensures a dropped event marker is inserted into the trace, informing the user that some events were dropped and the trace might not perfectly reflect reality.
Note
If your trace contains dropped events, all recordings past that point may be corrupted.
The Dropped Event Counter
Tonbandgerät maintains a single global counter that increments each time an event is dropped. This counter is shared across all cores.
Whenever a drop occurs, Tonbandgerät will attempt to encode and submit a dropped event counter event (a special trace event that carries the current value of the counter) on every subsequent trace event until one such counter event is successfully transmitted. This ensures the converter always learns about losses as soon as the channel recovers, assuming the dropped-event detecting reported by the backend is accurate.
If the counter event itself cannot be transmitted (the channel is still congested), the counter is incremented again and the actual event that triggered the attempt is abandoned. The next trace event will again try to submit a dropped event counter message.
Periodic Submission
As an additional safety measure, Tonbandgerät can also submit a dropped event
counter event periodically, even when no drops have occurred. This is controlled
by tband_configTRACE_DROP_CNT_EVERY:
// tband_config.h
#define tband_configTRACE_DROP_CNT_EVERY 50  // default
When set to a value N > 0, a dropped event counter event is submitted
approximately every N trace events. This gives the converter a regular
heartbeat it can use to confirm that no events were silently lost and provides
another assurance that the trace is accurate.
Set to 0 to disable periodic submission entirely. In that case, a counter
event is only emitted when the drop count actually changes. This saves a small
amount of bandwidth at the cost of the safety net.
Tip
The overhead of periodic submission is very small at the default interval of 50. It is generally worth keeping enabled unless bandwidth is extremely constrained.
In the Trace Viewer
When the converter detects a non-zero or increasing dropped event counter in the trace stream, it emits a log message to inform you that events were lost. This appears in the converter output alongside the converted trace.
Multi-core Support
Warning
This page has not been written yet.
Viewing Traces
The core trace decoder & interpreter is written in rust and can be found here. It emits the native protobuf format of Google’s perfetto, an in-browser trace viewer made for traces much bigger and denser than what this tool will ever generate.
To use this converter, two UIs are provided:
- The tband-cli command-line tool, and
- the web converter, an in-browser converter which embeds the converter cross-compiled to WASM.
CLI Trace Converter: tband-cli
Compile & Install
The trace converter and CLI is written in rust 🦀. To compile and run tband-cli locally, first you
need to download and install rust if you don’t already have it.
Then, open the ./tools/tband-cli folder.
Now you have two options. To compile & install tband-cli, run:
> cargo install --path .
This will compile the tool, and place the finished executable in your local cargo binary directory. Where that
is depends on your system. Most likely you will
have to add it to your PATH.
To build and run the CLI tool directly from the repository, type:
> cargo run --
Any command line arguments you want to provide need to go after the -- separator.
Commands
The tool features 5 main commands:
> tband-cli --help
Usage: tband-cli [OPTIONS] <COMMAND>

Commands:
  conv        Convert trace recording
  serve       Serve trace file for perfetto
  completion  Print completion script for specified shell
  dump        Dump trace recording
  help        Print this message or the help of the given subcommand(s)

Options:
  -v, --verbose...
  -h, --help        Print help
  -V, --version     Print version
conv
The conv command is where most of the action is. It takes one or more trace files, decodes them, and
converts them to the perfetto format:
> tband-cli conv --help
Convert trace recording

Usage: tband-cli conv [OPTIONS] [INPUT]...

Arguments:
  [INPUT]...
          Input files with optional core id.

          For split multi-core recording, append core id to file name as such: filename@core_id

Options:
  -f, --format <FORMAT>
          Input format

          [default: bin]
          [possible values: hex, bin]

  -m, --mode <MODE>
          TraceMode

          [default: free-rtos]
          [possible values: bare-metal, free-rtos]

  -c, --core-count <CORE_COUNT>
          Number of cores of target

          [default: 1]

  -o, --output <OUTPUT>
          Location to store converted trace

      --open
          Open converted trace in perfetto

      --serve
          Serve converted trace for perfetto

  -h, --help
          Print help (see a summary with '-h')
It supports both binary and hex trace files, and both bare-metal and FreeRTOS traces. After conversion,
the tool can save the result to a file (--output), open it directly in perfetto (--open), or
provide a link and host a local server to provide the trace to perfetto (--serve).
The input files must be given last. If converting a multi-core trace split into separate files, append the core id to each file as follows:
> tband-cli conv --format=bin --core-count=2 --open core0_trace.bin@0 core1_trace.bin@1
dump
The dump command takes a single trace file, decodes it, and dumps its content in human-readable form to stdout.
> tband-cli dump --help
Dump trace recording

Usage: tband-cli dump [OPTIONS] --mode <MODE> <INPUT>

Arguments:
  <INPUT>
          Input file with optional core id.

          For split multi-core recording, append core id to file name as such: filename@core_id

Options:
  -f, --format <FORMAT>
          Input format

          [default: bin]
          [possible values: hex, bin]

  -m, --mode <MODE>
          TraceMode

          [possible values: bare-metal, free-rtos]

  -h, --help
          Print help (see a summary with '-h')
completion
The completion command can generate shell completion scripts for most common shells. How you can install a completion script depends on your shell and system configuration.
> tband-cli completion --help
Print completion script for specified shell

Usage: tband-cli completion <SHELL>

Arguments:
  <SHELL>  Style of completion script to generate [possible values: bash, elvish, fish, powershell, zsh]

Options:
  -h, --help  Print help
Web Trace Converter
The web converter can be found at:
https://schilk.co/Tonbandgeraet/
Overview
Traces can be added via file upload, or pasted as a hex/base64 string. Single-file traces can be uploaded, converted, and opened using the 1-CLICK-CONVERT button.
For multi-file traces, upload and add all traces, then press CONVERT, followed by OPEN to open the trace in perfetto or DOWNLOAD to download the perfetto-ready trace.
Note
The first time you use the web converter to redirect to perfetto, you will get a popup asking if you trust
schilk.co. If you do trust me, the trace will open. If you don’t, you will manually have to download the trace from the converter and upload it to perfetto.
The Tonbandgerät Binary Trace Format
To store trace events in a compact binary format, Tonbandgerät uses zero-delimited COBS frames each containing a single trace event. The set of trace event types (each identified by an 8 bit id) and their respective structure is fixed.
Trace Event Structure
Inside the COBS frame, each event type is structured as follows:
- An 8-bit ID, which identifies the type of trace event and hence internal structure of the fields to follow.
- Zero or more required known-length fields, which are always present in every event instance of this type.
- One of the following:
- Zero or more optional known-length fields, which (under some restrictions) are not required to be present in every event instance of this type.
- One variable-length field.
- Nothing
Some examples of valid event structures follow, where each field is denoted as name:type with optional fields enclosed in square braces ([]), and variable-length fields appended with an ellipses (...):
id:u8
id:u8 field1:u64
id:u8 field1:u64 field2:u8
id:u8 field1:u64 (opt:s64)
id:u8 field1:u64 (opt:s64) (abc:u8)
id:u8 (opt:s64)  (abc:u8)
id:u8 field1:64  name:str...
id:u8 name:str...
See here for a description of the specific field types.
Known-length fields
Known-length fields are fields whose encoded length is either fixed (such as u8 fields, which are always 1 byte)
or can be determined from the encoded data (such as u32 fields, whose varlen encoding scheme identifies the last
byte of a field by having its MSB be zero, see field types).
Required fields
Required fields are straight forward to encode and decode: The encoder serializes all fields and inserts them sequentially into the event frame. Since they are all required to be known-length fields, and the decoder is aware of the set of required fields present, it can simply identify and decode them.
Optional fields
Optional fields must not necessarily be included in an event. If they are present, they are encoded as usual. If they are not present, they are simply omitted. Importantly however, they must always appear in the order in which they are defined and cannot be excluded and included freely without restriction:
If an event type contains \(N\) optional fields, an event instance may only exclude the last \(0 \leq n \leq N\) fields. In other words, if an event type contains the optional fields \(A\), \(B\), and \(C\), valid event instances could only take on one of the following layouts:
- \(\emptyset\)
- \(A\)
- \(A\), \(B\)
- \(A\), \(B\), \(C\)
This restriction comes from the fact that, to save space, there is no field identification mechanism in the trace format. Instead, while decoding optional events, the decoder will simply continue to decode until it reaches the end of the frame, and mark all events that were not seen as not present.
Variable-length fields
Variable length fields (such as strings) are encoded without any delimiter. Since they must appear as the last field in an event, the decoder assumes that all bytes that follow the last required field are a part of the variable-length field.
COBS Framing
The tracer uses COBS (Consistent Overhead Byte Stuffing, wikipedia) framing to separate binary trace events that have been stored or transmitted together. Specifically, the COBS algorithm removes all zeroes from a binary message in a reversible fashion, with only minimal overhead. Zeroes are then used to delimit individual trace messages.
Specifically, after COBS framing, an \( N \neq 0 \) byte message will be at most \( 1 + \left\lceil \frac{N}{254} \right\rceil + N \) bytes long, including a trailing zero for delimitation.
Please read the above article for a more precise specification, but roughly speaking this is done by replacing all zeroes with a pointer to the next zero:
Original values:          0x01  0x02  0x00  0x04  0x00  0x05

                      +-----> +3 -----+  +-> +2 --+  +-> +2 --+
                      |               |  |        |  |        |
COBS framed:       0x03   0x01  0x02  0x02  0x04  0x02  0x05  0x00

                   Start  Data  Data  Zero  Data  Zero  Data  Delim.
Special care has to be given to a run of 254 or more consecutive non-zero bytes, as an 8-bit pointer is not sufficient to point beyond such a run. In this case, an additional pointer byte is added that does not correspond to a zero in the original data:
Original values:          0x00  0x01  0x02 ... 0xFD  0xFE         0xFF

                      +->-+  +----------> +255 ------------+  +--> +2 --+
                      |   |  |                             |  |         |
COBS framed:       0x01   0xFF  0x01  0x02 ... 0xFD  0xFE  0x02   0xFF  0x00

                  Start   Zero  Data  Zero ... Data  Zero  Extra  Data  Delim.
When decoding, the value pointed at by a 0xFF pointer must therefore not be decoded to a zero but only be interpreted as a
another pointer.
Because trace events are usually very short, this means that most can be framed with only two bytes of overhead.
Varlen Encoding
Many trace events feature large fields that often contain only a very small value. For example, all interrupt-related events feature a 32-bit interrupt ID, but most microcontrollers will at most have a few hundred interrupts. This would mean that most bytes of most numeric fields are zero most of the time, wasting trace storage capacity or transfer bandwidth.
To combat this, Tonbandgerät uses the same specific form of variable-length (varlen) encoding that is also used by UTF-8 for most numeric values:
Values are split into 7-bit septets, and are encoded starting with the least significant septet. Each septet is encoded as an 8-bit value, consisting of the septet in the lower bits, and a control bit in the most significant bit position that is set to
1if there are more septets to follow, or0if this is the last septet and all following bits should be assumed to be zero.
For example, consider the 32-bit value 0x5. With the scheme above, it is encoded as a single
byte:
        +---> First 7 bits
     ___|___
    00000101
    |
    +--> No more bits to follow.
The value 0xFF requires more than seven bits and therefore is split into two bytes:
        +---> First 7 bits          +---> Next 7 bits
     ___|___                     ___|___
    11111111                    00000001
    |                           |
    +--> More bits to follow.   +--> No more bits to follow.
This system trades a much improved average message length for a longer worst-case message size.
Trace Event Fields
The following field types are supported in trace packages:
u8
An unsigned, 8-bit value. Encoded as-is.
u32
An unsigned, 32-bit value. Encoded as a varlen unsigned value.
u64
An unsigned, 64-bit value. Encoded as a varlen unsigned value.
s64
A signed 64-bit value. Encoded in sign-magnitude form as a varlen value.
When encoded, the least significant bit indicates the sign of the value, with
a 1 marking the value as negative. All other bits (once shifted to the right
by one) give the magnitude of the value. The only exception is INT64_MIN, whose magnitude would
overflow a 63 bit representation. It is instead encoded as negative zero (0x01).
This is done to efficiently encode small negative integers, which would otherwise always require 10 bytes after varlen encoding due to the set MSB in the twos-complement representation of negative values.
str
A varlen string. Encoded as-is. Must be the final value in the frame. Length given by end of frame.
Code Generation
The set of possible tracing events and their fields is defined in a simple python code generation script here. Based on this, the c event encoder, an event encoder test file, the rust event decoder, and the event index documentation is generated.
Example Output
Consider the following isr_name event as an example:
- Metadata: yes
- Max length (unframed): 6 bytes + varlen field
C Encoder
First, the code generator will emit a macro that specifies if the event is a metadata event (meaning it should be appended to the metadata buffer) and a macro that gives the maximum framed length of the event so that a buffer can be pre-allocated. Then, a function is generated that takes the event fields and encodes them into a buffer, returning the actual encoded length of the message (including a trailing zero termination).
#define EVT_ISR_NAME_IS_METADATA (1)
#define EVT_ISR_NAME_MAXLEN (COBS_MAXLEN((6 + tband_configMAX_STR_LEN)))
static inline size_t encode_isr_name(uint8_t buf[EVT_ISR_NAME_MAXLEN], uint32_t isr_id, const char *name) {/* .. */}
Rust Decoder
The rust code generator emits a struct representing the event, and a decoder function that attempts to reconstruct the event from a binary buffer:
#[derive(Debug, Clone, Serialize)]
pub struct BaseIsrNameEvt {
    pub isr_id: u32,
    pub name: String,
}

impl BaseIsrNameEvt {
    fn decode(buf: &[u8], current_idx: &mut usize) -> anyhow::Result<RawEvt> { /* .. */ }
}
Trace Events Index
Index of all Tonbandgerät tracing events.
Important
This file is automatically generated. See code generation documentation for details.
Base:
Base/core_id:
- Metadata: no
- Max length (unframed): 16 bytes
Base/dropped_evt_cnt:
- Metadata: no
- Max length (unframed): 16 bytes
Base/ts_resolution_ns:
- Metadata: yes
- Max length (unframed): 11 bytes
Base/isr_name:
- Metadata: yes
- Max length (unframed): 6 bytes + varlen field
Base/isr_enter:
- Metadata: no
- Max length (unframed): 16 bytes
Base/isr_exit:
- Metadata: no
- Max length (unframed): 16 bytes
Base/evtmarker_name:
- Metadata: yes
- Max length (unframed): 6 bytes + varlen field
Base/evtmarker:
- Metadata: no
- Max length (unframed): 16 bytes + varlen field
Base/evtmarker_begin:
- Metadata: no
- Max length (unframed): 16 bytes + varlen field
Base/evtmarker_end:
- Metadata: no
- Max length (unframed): 16 bytes
Base/valmarker_name:
- Metadata: yes
- Max length (unframed): 6 bytes + varlen field
Base/valmarker:
- Metadata: no
- Max length (unframed): 26 bytes
FreeRTOS:
FreeRTOS Enums:
FrQueueKind:
- 0x00:
FRQK_QUEUE - 0x01:
FRQK_COUNTING_SEMPHR - 0x02:
FRQK_BINARY_SEMPHR - 0x03:
FRQK_MUTEX - 0x04:
FRQK_RECURSIVE_MUTEX - 0x05:
FRQK_QUEUE_SET
FrStreamBufferKind:
- 0x00:
FRSBK_STREAM_BUFFER - 0x01:
FRSBK_MESSAGE_BUFFER
FreeRTOS/task_switched_in:
- Metadata: no
- Max length (unframed): 16 bytes
FreeRTOS/task_to_rdy_state:
- Metadata: no
- Max length (unframed): 16 bytes
FreeRTOS/task_resumed:
- Metadata: no
- Max length (unframed): 16 bytes
FreeRTOS/task_resumed_from_isr:
- Metadata: no
- Max length (unframed): 16 bytes
FreeRTOS/task_suspended:
- Metadata: no
- Max length (unframed): 16 bytes
FreeRTOS/curtask_delay:
- Metadata: no
- Max length (unframed): 16 bytes
FreeRTOS/curtask_delay_until:
- Metadata: no
- Max length (unframed): 16 bytes
FreeRTOS/task_priority_set:
- Metadata: no
- Max length (unframed): 21 bytes
FreeRTOS/task_priority_inherit:
- Metadata: no
- Max length (unframed): 21 bytes
FreeRTOS/task_priority_disinherit:
- Metadata: no
- Max length (unframed): 21 bytes
FreeRTOS/task_created:
- Metadata: no
- Max length (unframed): 16 bytes
FreeRTOS/task_name:
- Metadata: yes
- Max length (unframed): 6 bytes + varlen field
FreeRTOS/task_is_idle_task:
- Metadata: yes
- Max length (unframed): 11 bytes
FreeRTOS/task_is_timer_task:
- Metadata: yes
- Max length (unframed): 6 bytes
FreeRTOS/task_deleted:
- Metadata: no
- Max length (unframed): 16 bytes
FreeRTOS/queue_created:
- Metadata: no
- Max length (unframed): 16 bytes
FreeRTOS/queue_name:
- Metadata: yes
- Max length (unframed): 6 bytes + varlen field
FreeRTOS/queue_kind:
| Field Name: | id | queue_id | kind |
|---|---|---|---|
| Field Type: | u8 | u32 | u8 enum FrQueueKind |
| Note: | 0x65 | required | required |
- Metadata: yes
- Max length (unframed): 7 bytes
FreeRTOS/queue_send:
- Metadata: no
- Max length (unframed): 21 bytes
FreeRTOS/queue_send_from_isr:
- Metadata: no
- Max length (unframed): 21 bytes
FreeRTOS/queue_overwrite:
- Metadata: no
- Max length (unframed): 21 bytes
FreeRTOS/queue_overwrite_from_isr:
- Metadata: no
- Max length (unframed): 21 bytes
FreeRTOS/queue_receive:
- Metadata: no
- Max length (unframed): 21 bytes
FreeRTOS/queue_receive_from_isr:
- Metadata: no
- Max length (unframed): 21 bytes
FreeRTOS/queue_reset:
- Metadata: no
- Max length (unframed): 16 bytes
FreeRTOS/curtask_block_on_queue_peek:
- Metadata: no
- Max length (unframed): 21 bytes
FreeRTOS/curtask_block_on_queue_send:
- Metadata: no
- Max length (unframed): 21 bytes
FreeRTOS/curtask_block_on_queue_receive:
- Metadata: no
- Max length (unframed): 21 bytes
FreeRTOS/queue_cur_length:
- Metadata: no
- Max length (unframed): 21 bytes
FreeRTOS/task_evtmarker_name:
- Metadata: yes
- Max length (unframed): 11 bytes + varlen field
FreeRTOS/task_evtmarker:
- Metadata: no
- Max length (unframed): 16 bytes + varlen field
FreeRTOS/task_evtmarker_begin:
- Metadata: no
- Max length (unframed): 16 bytes + varlen field
FreeRTOS/task_evtmarker_end:
- Metadata: no
- Max length (unframed): 16 bytes
FreeRTOS/task_valmarker_name:
- Metadata: yes
- Max length (unframed): 11 bytes + varlen field
FreeRTOS/task_valmarker:
- Metadata: no
- Max length (unframed): 26 bytes